"Low carb" is one of the most-used and least-defined words in nutrition. To one person it means skipping the bread roll; to another it means 20 grams of carbs a day and measuring ketones. Those aren't the same diet, they don't do the same things, and lumping them together is where most of the confusion, and most of the bad advice, comes from. This is the plain-English version: how low counts as low, what the research actually shows, and the genuine scientific fight over why it works.
General information, not personal medical advice. This is a YMYL health topic, read the safety section, and speak to your GP or an Accredited Practising Dietitian before making big dietary changes, especially with a health condition or medication.
Low carb means getting a smaller share of your energy from carbohydrate and more from protein and fat. It is a spectrum: moderate restriction (~26–45% of energy), genuine low-carb (under ~26%, roughly under 130g a day), and very-low-carbohydrate or ketogenic (under ~50g). The key thing people miss: low carb is not automatically keto. You only reach ketosis at the far end of the spectrum. Most people who "eat low carb" never get there, and don't need to. → Keto page for the deep end.
Carbohydrate restriction for weight is old. In 1863, London undertaker William Banting published a wildly popular pamphlet describing how cutting bread, sugar and potatoes reversed his obesity, arguably the first mainstream low-carb diet book. The idea resurfaced with Robert Atkins in 1972 (→ Atkins page), and has since matured into a serious clinical tool for type 2 diabetes and metabolic health.
Carbohydrate is the macronutrient that most raises blood glucose and, in turn, insulin. Eat fewer carbs and those post-meal glucose and insulin spikes flatten out. Because you're replacing carbs with protein and fat, the two most filling macronutrients, many people simply feel less hungry and eat less without trying. A chunk of the fast early weight loss is water: every gram of stored glycogen holds several grams of water, and glycogen drops first. Whether there's a genuine metabolic advantage beyond "you ate less" is the central debate below.
The most important trial here is DIETFITS (Gardner et al., JAMA 2018): 609 adults randomised to a healthy low-fat or a healthy low-carb diet for 12 months lost almost identical amounts (−5.3 kg vs −6.0 kg, not a significant difference).[1] Two findings made headlines: neither a person's insulin-secretion status nor a genetic pattern predicted which diet worked better for them. Gardner's takeaway became one of the most-cited lines in modern diet science, diet quality and adherence matter more than the carb-to-fat ratio.
Low-carb reliably improves blood-sugar control and weight in the short term (up to ~6 months); the advantage over higher-carb approaches tends to shrink by 12–24 months as adherence drifts.[1] It's a legitimate, evidence-supported option for managing type 2 diabetes.
Low-carb typically raises HDL and lowers triglycerides. The LDL response is variable and can rise, especially when the fat added back is saturated. That variability is the crux of the cardiovascular debate (covered on the Keto page's lipid section).
The best long-horizon data comes from Seidelmann et al. (Lancet Public Health, 2018), the ARIC cohort (15,400 adults) plus a meta-analysis of 432,179 people. It found a U-shaped relationship: lowest mortality at around 50–55% of energy from carbohydrate, with higher risk at both very low (<40%) and very high (>70%) intakes.[2] The twist that matters more than the U itself: what you replace carbs with decides the risk. Swapping carbs for animal fat and protein was linked to higher mortality; swapping for plant fat and protein, to lower mortality.[2] "Low carb" bacon-and-butter and "low carb" olive-oil-and-legumes are not the same bet.
This is the fault line in obesity science, and it applies directly to moderate carb restriction. Tap to expand.
Refined carbs spike insulin, insulin partitions energy into fat storage, and the resulting "internal starvation" makes you overeat, so carbs are hormonally fattening, not just calories. (AJCN, 2021.)[3]
The CIM isn't supported by controlled data; total energy (driven by energy-dense, processed food and appetite) is the proximate cause. Hall's own metabolic-ward studies show only tiny fat-loss differences when carbs are swapped for fat. (AJCN, 2022.)[4]
For moderate carb restriction, most tightly controlled data favour the energy-balance view that adherence and total calories dominate. But both camps agree on the practical point, cut refined, processed carbohydrates. Treat anyone who says this is "settled" either way with suspicion.
"The scales dropping fast means it's working."
The fast early drop is largely water, glycogen and its bound water go first. It's not a fat-loss miracle.
"'Net carbs' is an official number."
"Net carbs" is marketing, not a regulated term. Useful shorthand, but subtract fibre honestly.
"Low carb means keto."
You have to go much lower to reach ketosis, and most people don't. → Keto
"Low carb is automatically healthy."
A plant-forward low-carb diet and a processed-meat one diverge sharply on the long-term data (the substitution effect above).[2]
Infographic 5, the myth-vs-science card set above.
May suit people with type 2 diabetes or insulin resistance (short-term glycaemic control) and anyone who finds protein and fat more filling. Approach with care, or avoid, if you're pregnant or breastfeeding, have type 1 diabetes, kidney disease, a history of disordered eating, or are cooking for children.
Referral gate: General information, not personal advice. Talk to your GP or an Accredited Practising Dietitian (APD) before making big changes, find one via Dietitians Australia.
Dietitians Australia's position: low-carb can help glycaemic control and weight in overweight type 2 diabetes short-term (≤6 months) but shows no clear long-term advantage, with weak evidence in type 1 and none supporting it for children, pregnancy or kidney disease. The NHMRC Acceptable Macronutrient Distribution Range for carbohydrate is 45–65% of energy, genuine low-carb sits below official guidance, which a credible page states plainly.
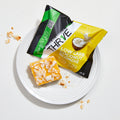
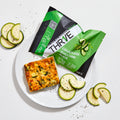
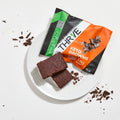
Eating fewer carbs is a lot easier when the counting's done for you. THR1VE builds lower-carb meals with the net carbs shown per serve, real food, made fresh, delivered chilled, so "carb-conscious" doesn't mean bland or DIY.
See lower-carb meals →Educational science above is general information with citations. THR1VE meals are described by their net carbs per serve; we don't imply a blood-glucose, diabetes or weight-loss benefit from the meals. "Low Carb" is a collection name, not an on-product health claim. (FSANZ 1.2.7 + ACL.)
Broadly under ~130g/day; "very low"/keto is under ~50g.[1]
No, keto is the strict end of the spectrum. → Keto
Early loss looks faster (water), but at 12 months low-carb and low-fat come out similar.[1]
The signal is that what replaces the carbs matters, plant-forward looks better than animal-heavy.[2]
★ = strong primary source. Named attributions (Gardner, Ludwig, Hall, Seidelmann) are accurate to the cited works.

We created THR1VE to transform the health and wellness of all Australians, through the delicious simplicity of real food nutrition and an active lifestyle.
Have a question? We are here to help!
support@thr1ve.meCall Us: (02) 7251 6686
Start a chat with our team©THR1VE 2025